Cohere-1M — 2026-10-07
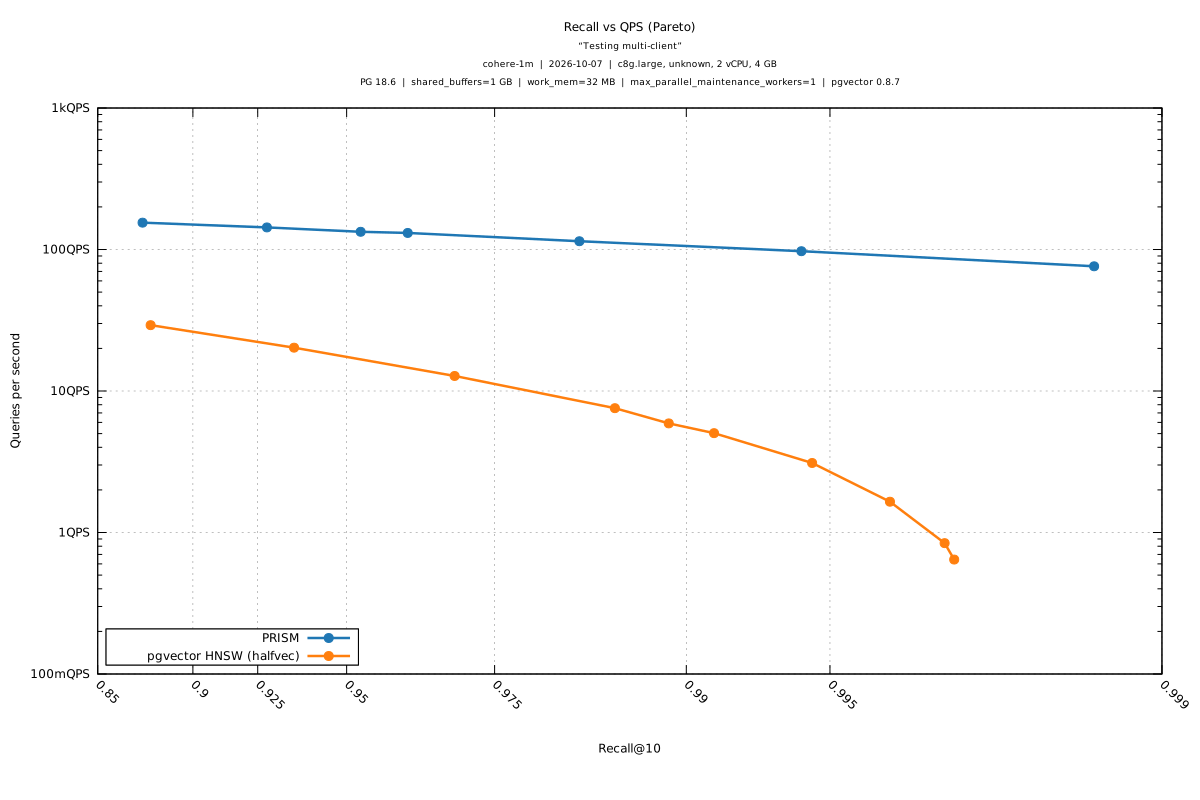
QPS at recall
| Recall | PRISM | pgvector HNSW (halfvec) | Δ vs best competitor |
|---|---|---|---|
| 0.90 | 149 | 26 | +483% |
| 0.95 | 135 | 17 | +702% |
| 0.99 | 104 | 6 | +1774% |
Throughput under load
| Recall · clients | PRISM | pgvector HNSW (halfvec) | Δ vs best competitor |
|---|---|---|---|
| 0.95 · 1 client | 133 (133) p50 7.57 ms · p95 11.34 ms | 17 (17) p50 59.33 ms · p95 88.58 ms | +702% |
| 0.95 · 2 clients (1x of 2 CPUs) | 129 (129) · 1.0× p50 15.24 ms · p95 24.89 ms | 23 (23) · 1.4× p50 84.09 ms · p95 127.42 ms | +452% |
| 0.95 · 4 clients (2x of 2 CPUs) | 129 (129) · 1.0× p50 29.93 ms · p95 49.66 ms | 23 (23) · 1.4× p50 169.47 ms · p95 255.36 ms | +456% |
| 0.99 · 1 client | 97 (97) p50 10.29 ms · p95 15.08 ms | 6 (6) p50 173.95 ms · p95 240.90 ms | +1581% |
| 0.99 · 2 clients (1x of 2 CPUs) | 109 (109) · 1.1× p50 17.81 ms · p95 28.48 ms | 8 (8) · 1.4× p50 246.53 ms · p95 343.30 ms | +1243% |
| 0.99 · 4 clients (2x of 2 CPUs) | 109 (109) · 1.1× p50 35.13 ms · p95 59.68 ms | 8 (8) · 1.4× p50 495.36 ms · p95 690.69 ms | +1243% |
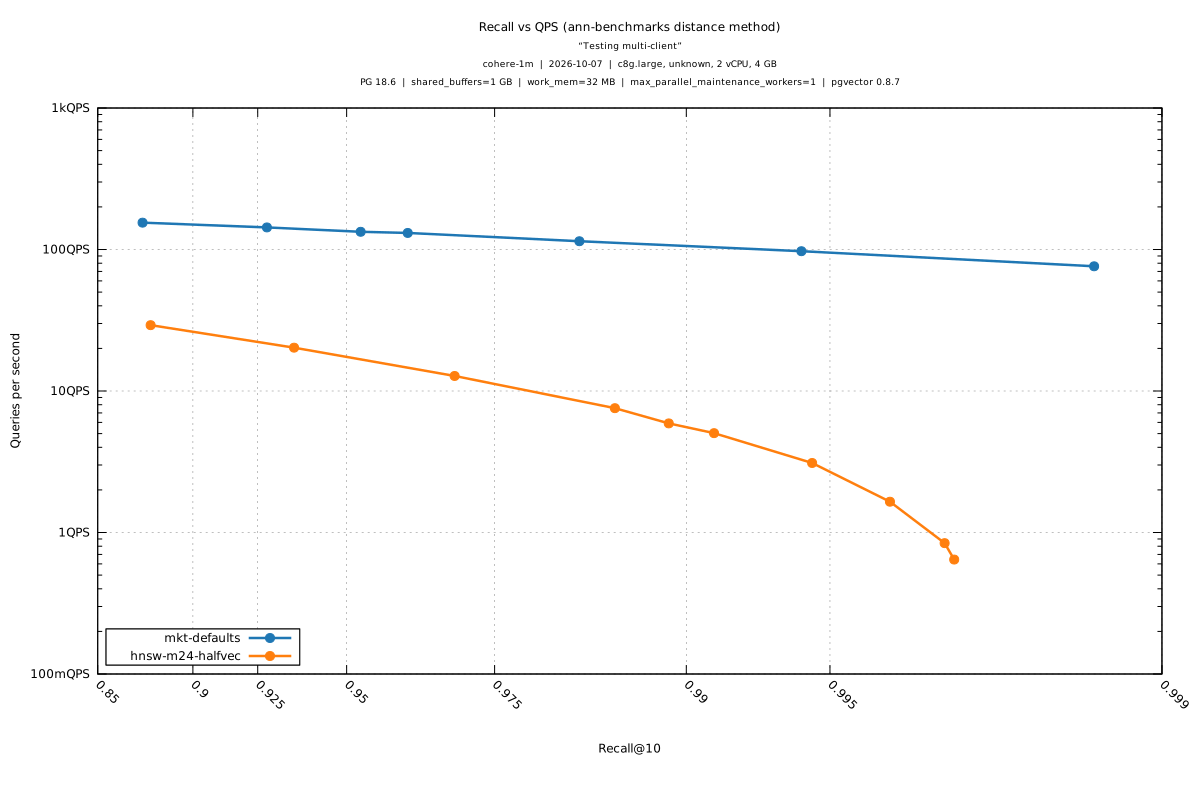
Each configuration is measured at its operating point for the target: its fastest sweep point whose recall reaches it. Values are measured there, not interpolated, so the recall can be above the target. Each cell is wall-clock QPS over the whole run, then in parentheses the throughput while every client is busy, which leaves out the drain at the end, and below them the p50 and p95 query latency over all clients. With more than one client, N× is the speedup: wall-clock QPS over the same configuration's single-client wall-clock QPS at that target. Ideal scaling matches the client count until the host's CPUs saturate, after which it flattens. Clients are concurrent connections from rekall, and CPU counts are the rekall host's. Wall-clock QPS includes rekall's own work between queries, so the 1-client row reads a little below QPS at recall, which comes from query latency. Recall is distance-based (ann-benchmarks, tie-aware).
Measured on config — PRISM @0.95: mkt-defaults (r=0.968) · pgvector HNSW (halfvec) @0.95: hnsw-m24-halfvec (r=0.954) · PRISM @0.99: mkt-defaults (r=0.997) · pgvector HNSW (halfvec) @0.99: hnsw-m24-halfvec (r=0.993)
Latency at recall
| PRISM | pgvector HNSW (halfvec) | Δ vs best competitor | |
|---|---|---|---|
| @ recall 0.90 | |||
| p50 | 6.68 ms | 38.31 ms | -83% |
| p95 | 10.70 ms | 60.47 ms | -82% |
| p99 | 12.92 ms | 74.03 ms | -83% |
| @ recall 0.95 | |||
| p50 | 7.28 ms | 58.93 ms | -88% |
| p95 | 12.46 ms | 87.35 ms | -86% |
| p99 | 16.78 ms | 103.69 ms | -84% |
| @ recall 0.99 | |||
| p50 | 9.69 ms | 181.08 ms | -95% |
| p95 | 14.10 ms | 252.19 ms | -94% |
| p99 | 17.12 ms | 284.93 ms | -94% |
All values are taken at exactly the stated recall: each configuration's own sweep is log-interpolated between its two surrounding measured points (measured values are used verbatim on an exact hit) and the best configuration at that recall is shown — values are never interpolated across different configurations. “—” means no single sweep spans that recall; nothing is extrapolated. Recall is distance-based (ann-benchmarks, tie-aware). Insert/update/delete workloads are not measured.
Interpolated on config — PRISM @0.90: mkt-defaults · pgvector HNSW (halfvec) @0.90: hnsw-m24-halfvec · PRISM @0.95: mkt-defaults · pgvector HNSW (halfvec) @0.95: hnsw-m24-halfvec · PRISM @0.99: mkt-defaults · pgvector HNSW (halfvec) @0.99: hnsw-m24-halfvec
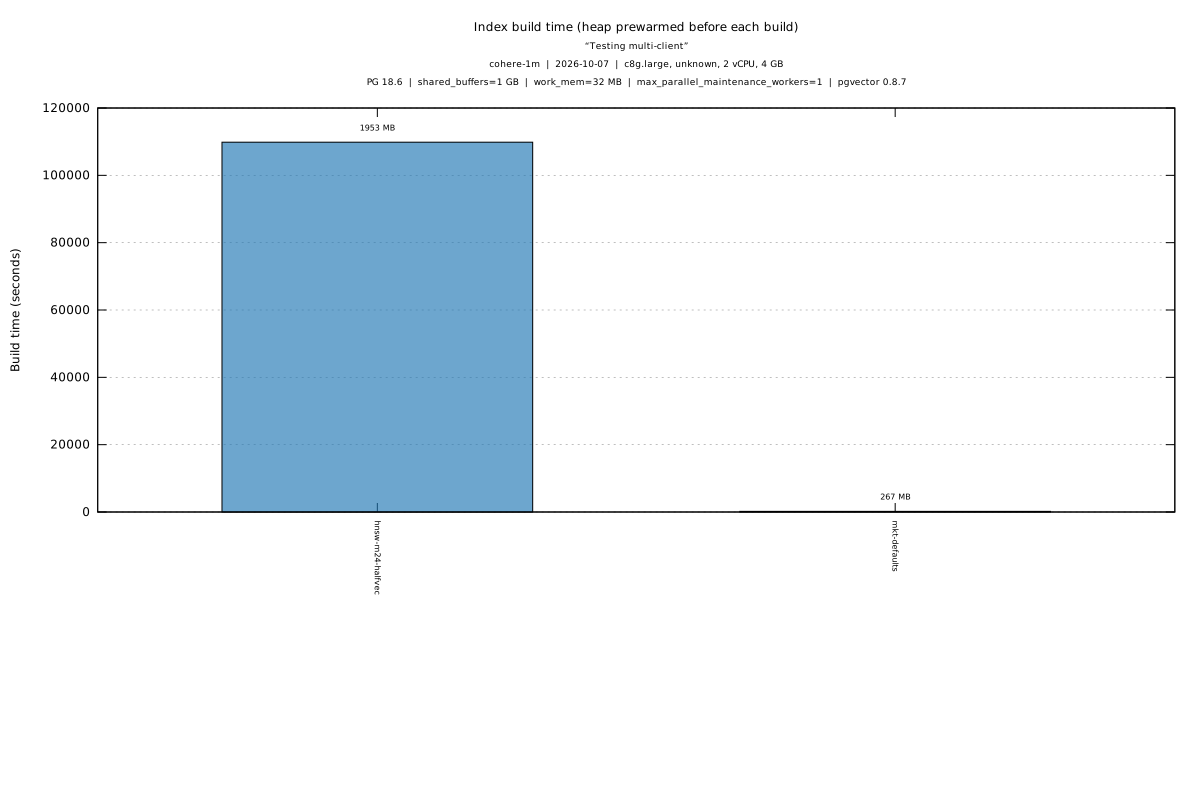
Build comparison
| PRISM | pgvector HNSW (halfvec) | Δ vs best competitor | |
|---|---|---|---|
| Build time | 191 s | 109849 s | -100% |
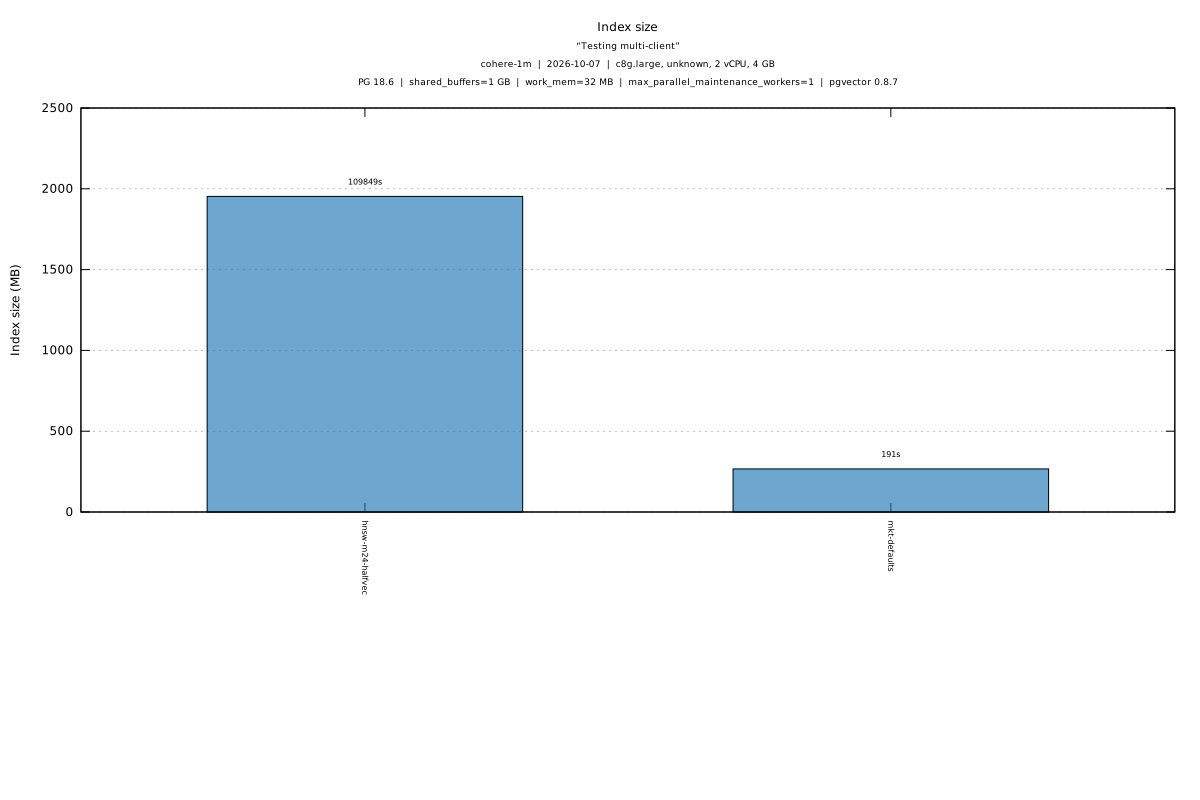
| Index size | 266.7 MB | 1.9 GB | -86% |
Build stats are for the configuration backing each column's best operating point: PRISM = mkt-defaults, prewarmed · pgvector HNSW (halfvec) = hnsw-m24-halfvec, prewarmed.
Plots
Pareto svg · Distance-recall svg · Per-config svg · Build times svg · Index sizes svg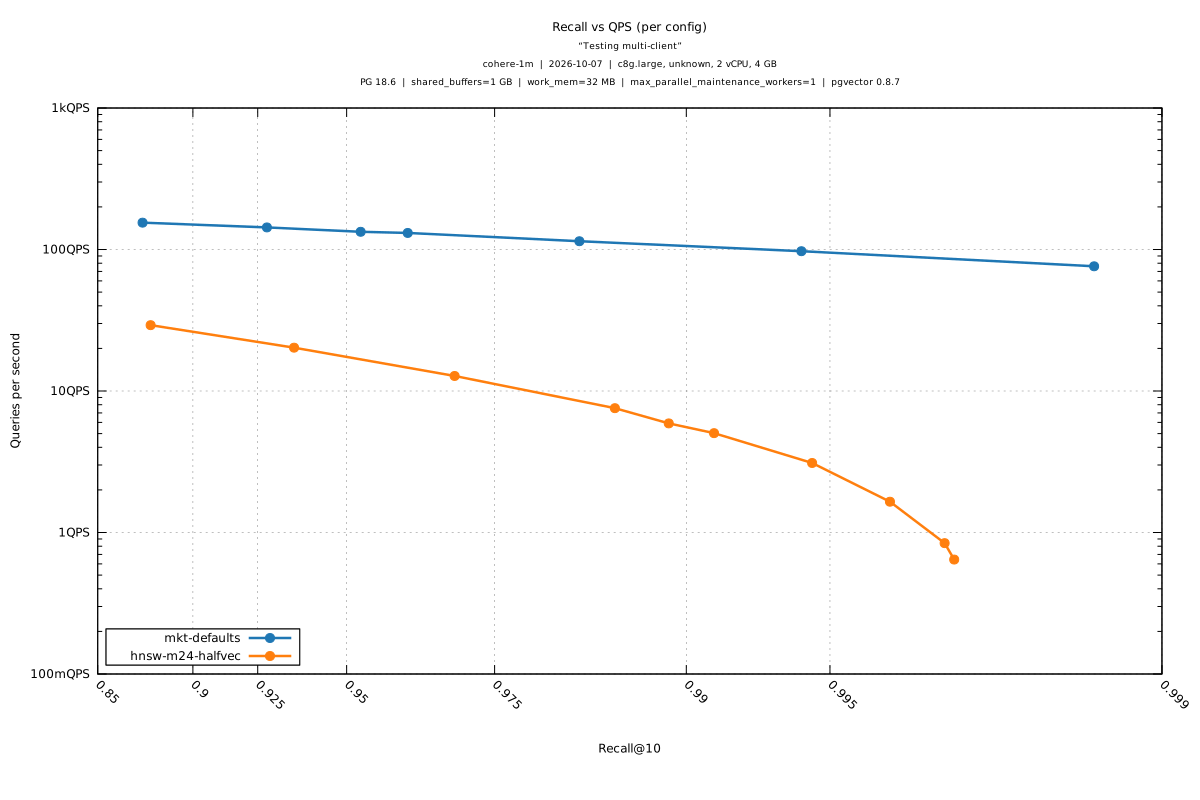
Host
| Instance type | c8g.large |
| Hostname | ip-172-31-39-39 |
| CPU | unknown (2 vCPU) |
| Memory | 4 GB |
| OS | Ubuntu 26.04.1 LTS |
| Kernel | 7.0.0-1014-aws |
Versions
| rekall | 0.1.0 (f31e456 / feature/concurrent-search) |
| PostgreSQL | PostgreSQL 18.6 (Ubuntu 18.6-1.pgdg26.04+2) on aarch64-unknown-linux-gnu, compiled by gcc (Ubuntu 15.2.0-16ubuntu1) 15.2.0, 64-bit |
| pg_prewarm | 1.2 |
| pg_vectorsearch | 0.1.0-dev (49e623d) |
| vector | 0.8.7 |
Search
| k | 10 |
| runs | 3 |
| warmup | 500 |
| num_queries | 10000 |
| S3 archive | s3://rekall-bench/runs/cohere-1m/2026-10-07/c8g.large-205958/ |
Index builds
| Index | Type | Build time | Size | Workers |
|---|---|---|---|---|
| hnsw-m24-halfvec | pgvector-hnsw | 109848.7s | 1.9 GB | 1 |
| mkt-defaults | prism | 190.9s | 266.7 MB | 1 |
Index parameters
hnsw-m24-halfvec: {"ef_construction":200,"encoding":"halfvec","m":24}
mkt-defaults: {"boundary_epsilon":null,"centroid_compression":null,"centroid_fastscan":null,"fan_out":null,"fastscan":null,"fastscan_bits":null,"nlist":null,"rerank_vectors":null,"soar_lambda":null}
Instance settings (observed)
instance type          c8g.large
vCPU (observed)        2
memory (observed)      3.7 GiB
cpu model              unknown
kernel                 7.0.0-1014-aws
data directory         /var/lib/postgresql/18/main
mount point            /
filesystem             ext4
media                  ebs
device                 nvme0n1
device size            107 GB
ebs volume             vol-006ea9c5a53c4edff
ebs volume type        gp3
provisioned IOPS       3000
provisioned throughput 125 MB/s
io scheduler           none
nr_requests            63
read_ahead_kb          128
PostgreSQL settings
checkpoint_completion_target = 0.9
cluster_name = 18/main
data_directory = /var/lib/postgresql/18/main
effective_cache_size = 3 GB
effective_io_concurrency = 200
huge_pages = try
jit = off
maintenance_io_concurrency = 200
maintenance_work_mem = 1 GB
max_connections = 54
max_parallel_maintenance_workers = 1
max_parallel_workers = 2
max_wal_size = 16 GB
random_page_cost = 1.1
server_version = 18.6 (Ubuntu 18.6-1.pgdg26.04+2)
shared_buffers = 1 GB
wal_level = replica
work_mem = 32 MB